Using income data from the RLMS
The Russian Longitudinal Monitoring Survey provides researchers with a generalisable and longitudinal sample of people in Russia (including both Russians and migrants). Lots of researchers use this data for a range of topics. They cite these statistics as broadly representative of Russian society. However, some of the income and wage stats in the dataset are different from estimates that you can find in Rosstat, the country’s statistics office, and the department of labour, respectively.
Income and wages as they appear in the RLMS
In this post, I take four years of data from the RLMS and compare it to official statistics from Rosstat. We’ll see that the median value for income and wages are about half of what is reported officially by Rosstat. The official website for the RLMS mentions that the sample is representable.
I am using the full longitudinal data file, which has all of the years assembled together, however I’m taking just five years of this survey for my purposes here.
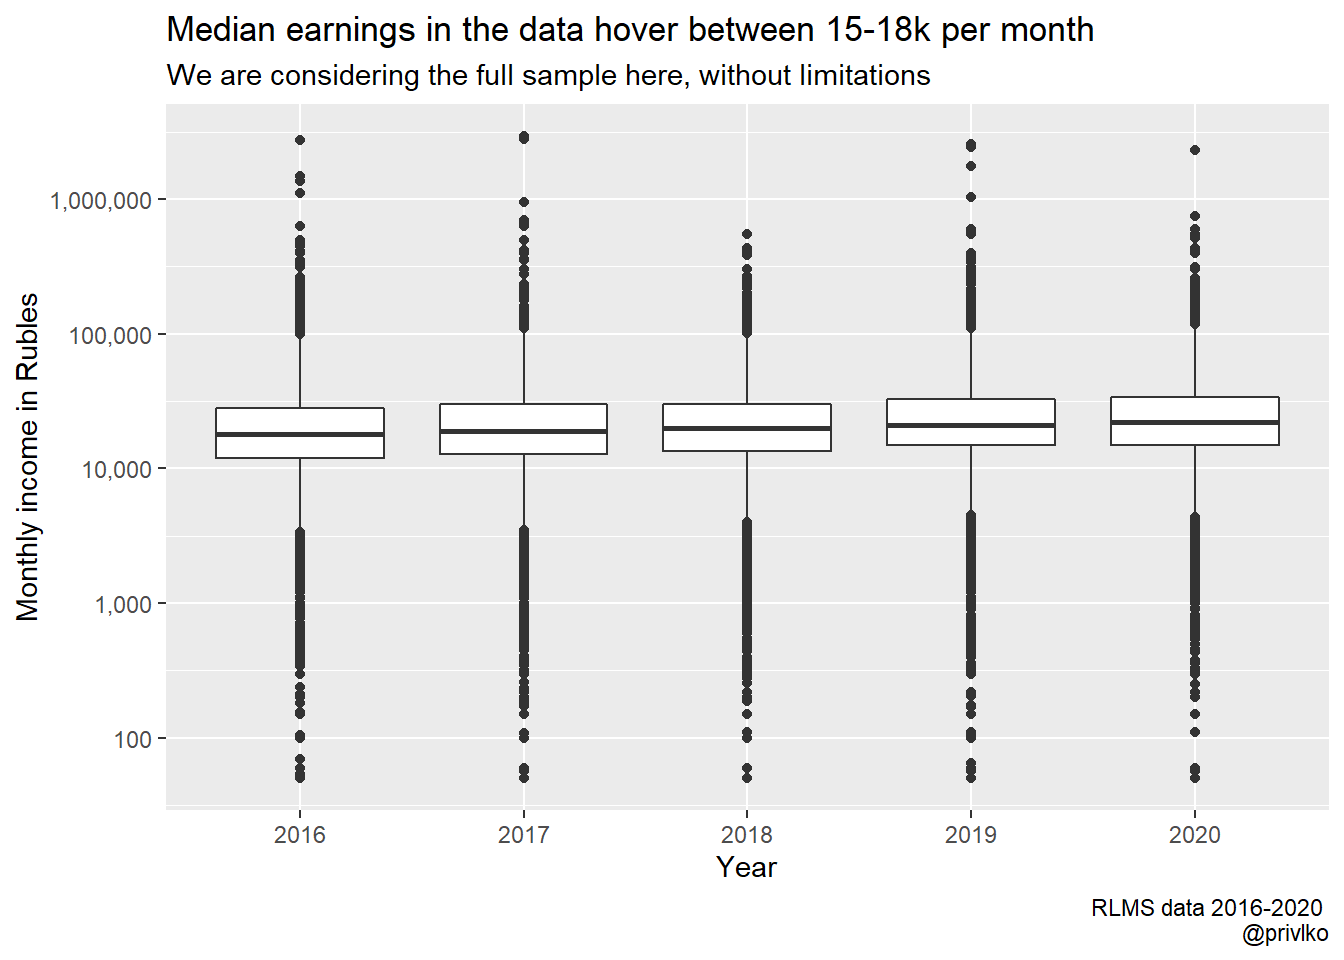
Using the questionnaire, we see that the specific question tied to income reads “Try to remember, please: What is the total amount of money that you personally received in the last 30 days. Please include everything: wages, retirement pensions, premiums, profits, material aid, incidental earnings, and other receipts, including foreign currency, but convert the currency into rubles.” This suggests the earnings measure is person-specific, and hot a household measure. It also suggests it has not been adjusted for inflation or household size (this will become necessary in later analyses).
This data is presented in the bloxplot below.
We can also focus on mean values which are broken down by income quintiles to better highlight this point. Average earning in the middle quintile hovers around the 20,000r mark, while the top quintile records a monthly income of just below the 60,000r mark.
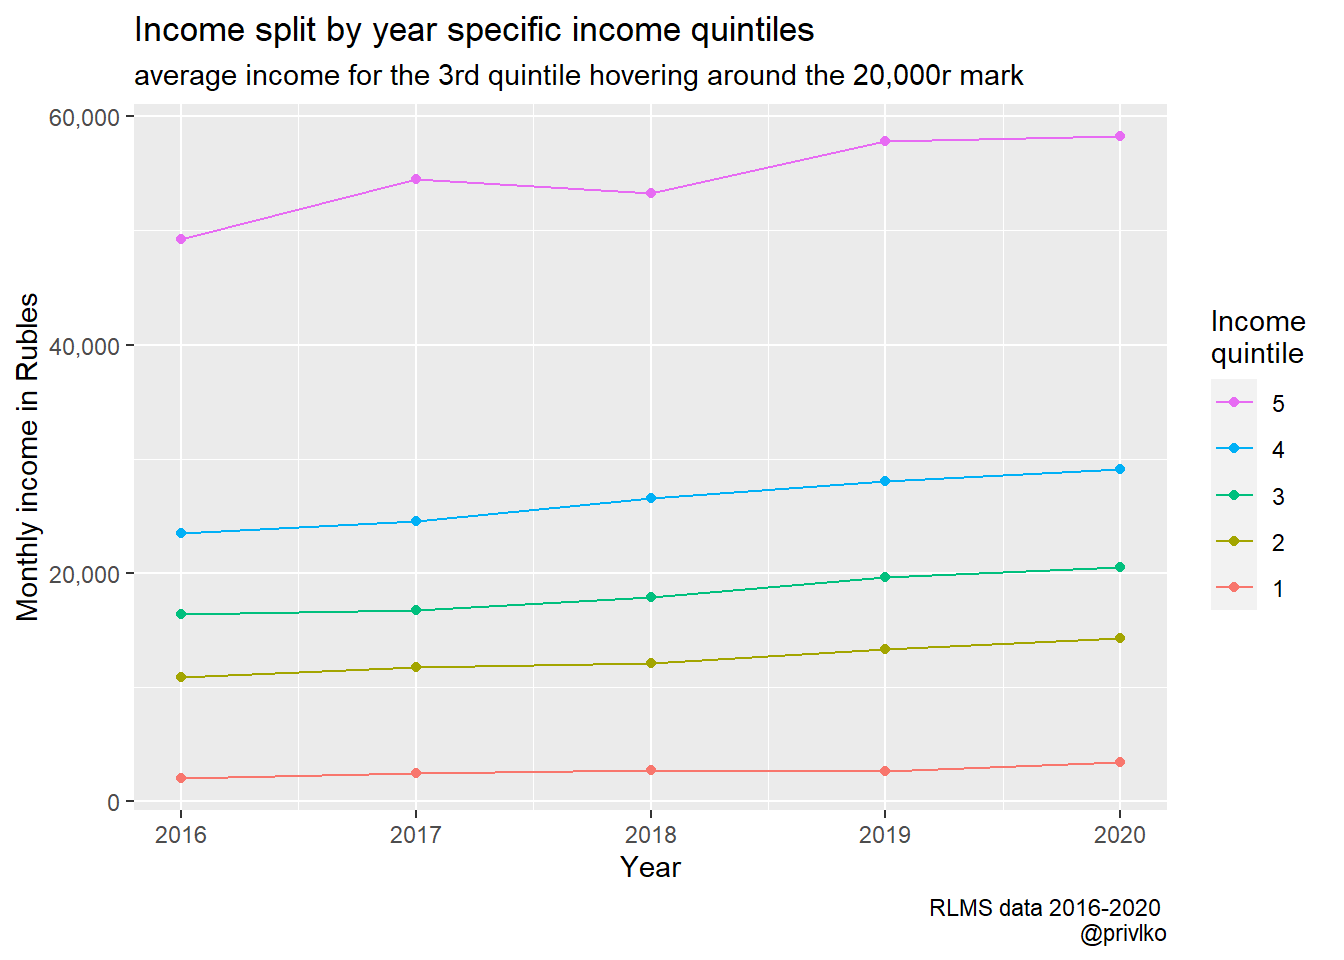
In short, the 3 quintile only crosses the 20,000r mark in 2020.
Income stats as they appear in official statistics
This section looks at mean income per capita as reported by Rosstat. We are looking at Table 1.1, specifically the measure labelled “Average per capita money income of population in roubles per month”. Here, we see that income is far higher than in the RLMS (30,700r+ in 2016). I am not quite sure what the discrepancy is about. I have adjusted for inflation, limited the age sample, and used individual level weights. So far I haven’t been able to replicate this figure.

Table 1.1 on income from the Russia in Figures Report
I have spoken to RLMS administrators and they are fairly confident in their estimates. One person did some digging on the Rosstat website and uncovered how the Rosstat figures are estimated. Since this measure is not easily explained, I will leave it for a separate blog post.
Conclusion
I have been writing this post for a while, and when I first started I thought the RLMS was underestimating earnings. Having spoken to several people now, I am pretty sure that the data is representative though could be improved with links to administrative sources as done by European surveys like EU-SILC.
Despite this, I will keep tracking the development of real income in the RLMS including its quintile differences. I have had an update on the possible sources of the difference in Rosstat, but I will discuss this another time.